I've just been comparing the results from my device with those obtained from the National Grid themselves. I'm pretty pleased with myself... here's a merged togther image, showing my line (red) and their line (blue).
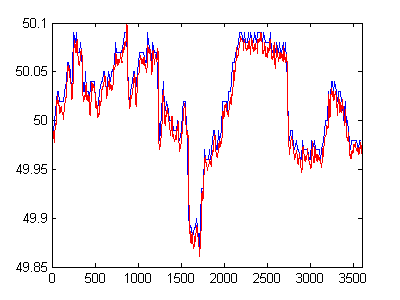
Lining up the graphs is kinda tricky, 'cause they update with a 15 second accuracy and I update with a two second one. I also have no idea if their data is averaged in instanatnous, which can explain some of the slight changes in shape. Anyway, the overall shape matches up pretty damn well even if I do say so myself :-)
The graphs are consistently under by 0.01 Hz. That means there is an error of 0.02% at 50 Hz, not too bad for a bit of kit that cost less than a tenner to build.
An error of 0.01 Hz relates to a timing error of about 4 microseconds at 50 Hz, which means that my timing is over determined by about 16 instuction cycles of my PIC. I'm half tempted to check through my code with the datasheet and workout where the timing values are being gained so I can know for sure... but instead I'm going to subtract 16 from the numbers I get back from the PIC... correcting my readings.
I'll check again tomorrow evening and see how well I match up...